
What is Accelerator Oscillator (AC)?
Click To Learn More
What is
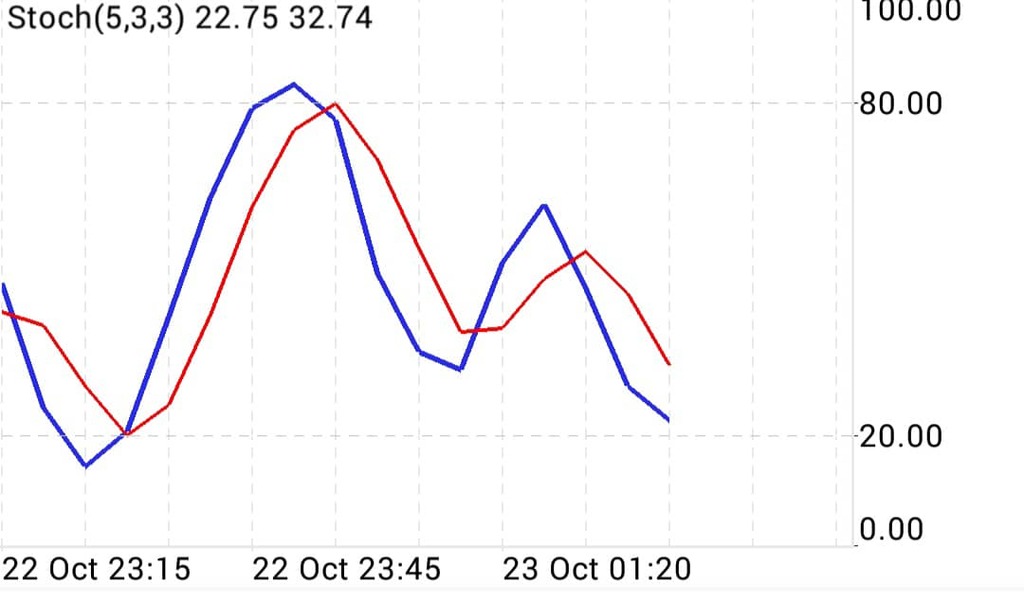
Stochastic Oscillator?
Click To Learn More
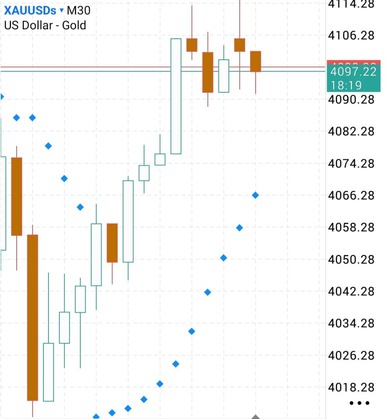
What is
Parabolic SAR?
Click To Learn More
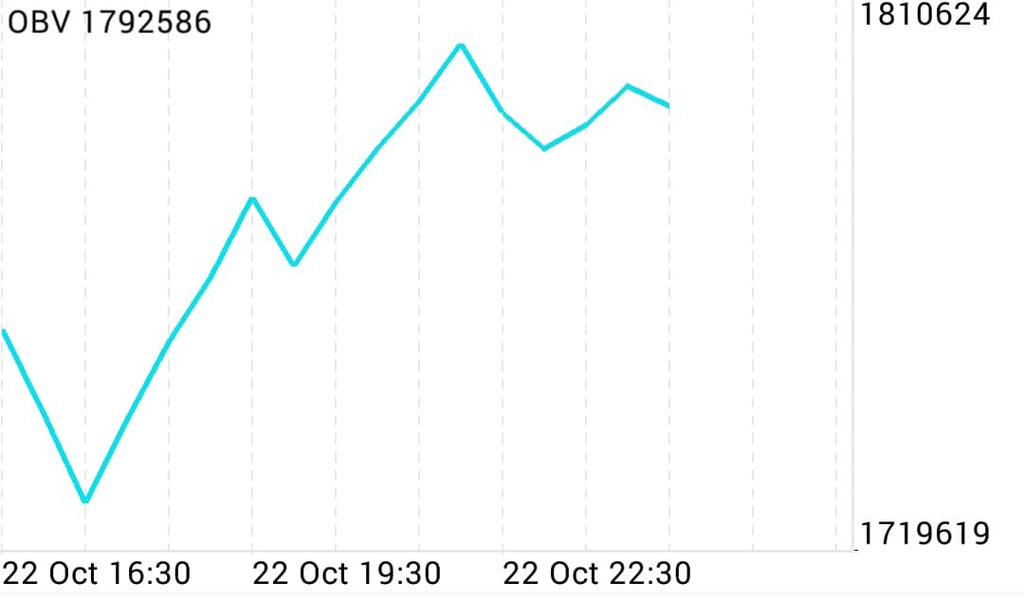
On Balance Volume
What is OBV?
Click To Learn More
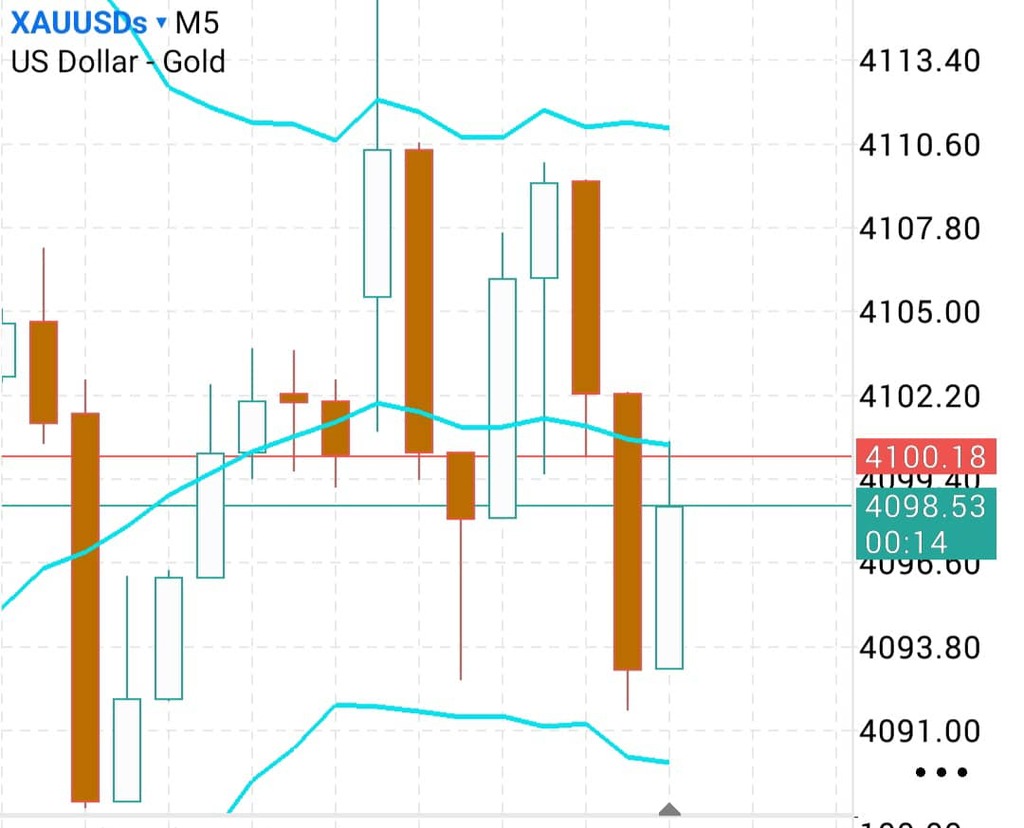
Each candlestick shows price movement during a specific time period (in this case, 4 hours).
It contains four key prices:
Open | The price when the 4H period started |
Close | The price when the 4H period ended |
High | The highest price reached within that 4H |
Low | The lowest price reached within that 4H |
🧩 How Small Candles Form the Big Candle
Inside one 4H candle, there are many smaller candles
(like 15-minute, 30-minute or 1-hour).
In this image:
What is Accelerator Oscillator (AC)?
Click To Learn More
What is
Click To Learn More
What is
Click To Learn More
What is OBV?
Click To Learn More


Broker, MT5 ECM, VPS & Prop. Firm