The Stochastic Oscillator measures momentum — how fast and how far price has moved relative to its recent range.
It tells you whether the market is overbought (too high) or oversold (too low).
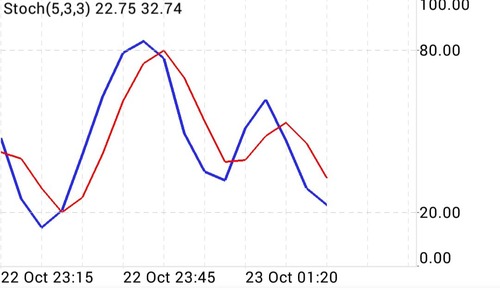
The settings you see (Stoch 5,3,3) are common:
- %K (Blue line): The main fast line.
- %D (Red line): The signal line (a moving average of %K).
Values range from 0 to 100.
📊 How to Read It
1️⃣ Overbought Zone (Above 80)
- When the blue line (%K) goes above 80, the market is considered overbought.
- It means price has moved up too quickly → possible downward correction soon.
- Sell signal when blue line crosses below red line while above 80.
2️⃣ Oversold Zone (Below 20)
- When the blue line goes below 20, the market is oversold.
- It means price has dropped too quickly → possible rebound up soon.
- Buy signal when blue line crosses above red line while below 20.
3️⃣ Crossovers
- Bullish crossover: Blue (%K) crosses above red (%D) near 20 → Buy signal
- Bearish crossover: Blue crosses below red near 80 → Sell signal
near 80 → Sell signal