What is Accelerator Oscillator (AC)
The Accelerator Oscillator measures the acceleration or deceleration of price momentum.
It’s designed to show momentum changes before the price actually reverses — meaning it’s often an early warning tool.
It’s derived from the Awesome Oscillator (AO):

…. so AC shows how quickly momentum is speeding up or slowing down.
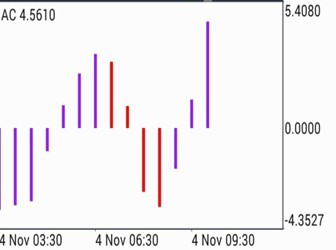
📊 How to Read the AC Histogram
You’ll see vertical bars (usually red and blue or green) oscillating above and below a zero line.
🔹 1️⃣ Above the Zero Line
- Market momentum is bullish (price tends to rise).
- If bars grow taller upward (increasing) → momentum accelerating up → possible buy opportunity.
- If bars shrink → bullish momentum slowing → possible pause or correction.
🔹 2️⃣ Below the Zero Line
- Market momentum is bearish (price tends to fall).
- If bars grow taller downward (increasing in negative) → momentum accelerating down → possible sell opportunity.
- If bars shrink → bearish momentum weakening → possible rebound soon.
🎨 Color Interpretation
- Blue (or Green) Bars: Momentum is increasing (acceleration).
- Red Bars: Momentum is decreasing (deceleration).
Each color change means the speed of the price move is changing — before the price itself turns.
🧭 How to Trade Using the Accelerator Oscillator
✅ Buy Setup
- Look for blue/green bars forming above the zero line — showing strong upward acceleration.
- If bars were red before and turn blue, it’s an early bullish signal.
- Confirm with:
- Parabolic SAR dots below candles, or
- Stochastic turning up from oversold.
📈 Entry idea: Buy when two consecutive blue bars appear above zero.
✅ Sell Setup
- Look for red bars forming below the zero line — showing strong downward acceleration.
- If bars were blue and turn red, it’s an early bearish signal.
- Confirm with:
- SAR dots above candles, or
- Stochastic turning down from overbought.
📉 Entry idea: Sell when two consecutive red bars appear below zero.