🔍 What is OBV
On-Balance Volume (OBV) is a volume-based momentum indicator that measures buying and selling pressure.
It uses trading volume to predict potential changes in price direction.
⚙️ How OBV Works
- If price closes higher than the previous close:
➜ Add the day’s (or candle’s) volume to OBV. - If price closes lower than the previous close:
➜ Subtract the day’s volume from OBV. - If price closes unchanged:
➜ OBV stays the same.
The result is a running total that rises when money is flowing into the asset
(buying pressure) and falls when money is flowing out (selling pressure).
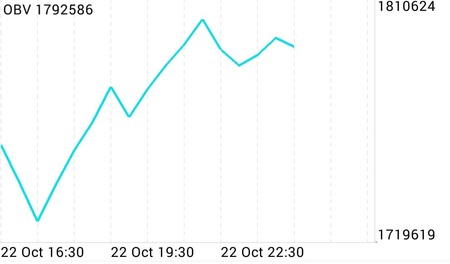
📊 How to Read the Chart shown
From your chart:
- OBV rises sharply from 22 Oct 16:30 to 22 Oct 19:30, meaning buying volume dominated → bullish sign.
- After that, OBV forms peaks and small dips — this shows slightly mixed volume, but still generally positive because it stays elevated.
- If price continues up while OBV also rises → confirms uptrend.
- If price stalls or falls while OBV keeps rising → could suggest accumulation (smart money buying quietly).
- If OBV starts falling while price still rises → possible bearish divergence, warning of trend weakness.