
πŸ“˜ What is Parabolic SAR


SAR stands for Stop And Reverse β€” it’s a trend-following indicator 
It helps you identify trend direction and potential reversal points.

πŸ”Ή How It Looks

On your chart:

  • The blue dots below the candles β†’ uptrend (bullish)
  • The blue dots above the candles β†’ downtrend (bearish)

So visually:

  • Dots below price = price trending up.
  • Dots above price = price trending down.


πŸ“Š How to Read It


1️⃣ When Dots Are Below the Candles

  • This signals a bullish trend.
  • You can look for buy opportunities.
  • Use the dots as a trailing stop β€” if the price closes below the dots, it might be time to exit or reverse.


2️⃣ When Dots Are Above the Candles

  • This signals a bearish trend.
  • You can look for sell opportunities.
  • Again, use the dots as a trailing stop β€” if the price closes above the dots, it might be a trend reversal.


πŸ”„ When the Dots Switch Sides

That’s the most important signal:

  • If dots flip from below to above β†’ possible sell signal (trend reversal down).
  • If dots flip from above to below β†’ possible buy signal (trend reversal up).

⚠️ However, wait for candle confirmation (like a strong engulfing candle) before entering

         β€” Parabolic SAR can give false signals in sideways markets.


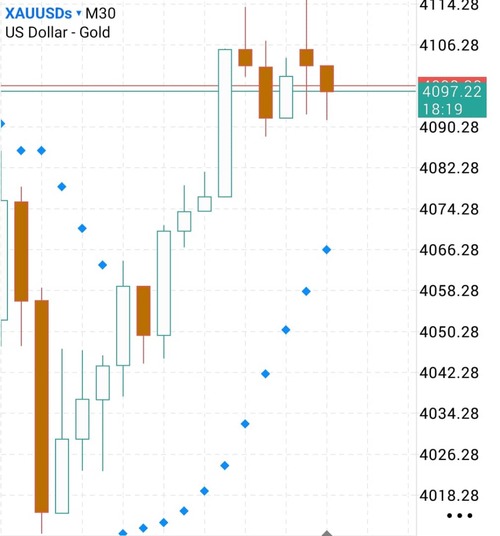
🧭 Example from Your Chart

Looking at your chart:

  • Timeframe: M30 (30-minute)
  • The blue dots are below the candles, showing that gold is in a strong uptrend.
  • As long as the dots stay below, the trend remains bullish.
  • If you see the next few candles print a dot above, that will be an early warning of reversal.

So right now β†’ trend is still upward, but the candles near $4100 show consolidation (sideways movement).
Watch for the first dot to appear above β€” that’s your potential short signal.

βš™οΈ Pro Tips for Using Parabolic SAR

βœ… Works best in trending markets, not sideways.
βœ… Combine it with moving averages or Bollinger Bands for confirmation.
βœ… Use it to trail your stop loss β€” move your SL to the latest SAR dot as price moves in your favor.
βœ… On gold, M15–H1 timeframes usually give better SAR signals than M1–M5 (too noisy).